

The Architecture of Deception: Why Story Points and Velocity Deceive Executives
The most common metric presented to business executives is agile "Velocity" measured in story points. Executives assume that if a team's velocity increases from 40 points to 60 points per sprint, the team has become 50% more productive.
This assumption is an operational illusion:
- Story Points are Relative and Subjective: Story points are an internal team estimation tool, not an absolute currency of value. Teams naturally recalibrate their estimates over time (story point inflation). A team can double its velocity simply by estimating a 3-point task as a 5-point task.
- Velocity Measures Effort, Not Value: A team can burn through 100 story points building features that no customer ever uses, or writing low-quality code that introduces crippling technical debt. Velocity says nothing about whether software is deployed to production, whether it is stable, or whether it generated business value.
- Story Points Mask Cross-Team Wait States: If an engineering pod finishes their user story in 3 days, but the code sits waiting in a staging queue for 6 weeks awaiting manual compliance review or infrastructure provisioning, measuring sprint velocity obscures the massive systemic delay.
---
The 3-Tier Delivery Telemetry Stack (BHR Code Analytical Model)
To eliminate subjective reporting, BHR Code structures delivery telemetry across three synchronized, automated tiers:
THE 3-TIER UNIFIED DELIVERY TELEMETRY STACK
┌────────────────────────────────────────────────────────────────────────┐
│ TIER 3: BUSINESS VALUE & OUTCOME REALIZATION                           │
│ - Feature Adoption Rate & Active User Penetration                      │
│ - Cloud Infrastructure Unit Cost per Transaction                       │
│ - Business Cycle Time Reduction & Direct Revenue Realization          │
└───────────────────────────────────▲────────────────────────────────────┘
│ (Correlated to)
┌───────────────────────────────────┴────────────────────────────────────┐
│ TIER 2: VALUE STREAM FLOW TELEMETRY (Flow Framework)                   │
│ - Flow Time: Elapsed duration from backlog intake to production active │
│ - Flow Efficiency: Active coding time vs. waiting on dependencies      │
│ - Flow Load: Total Work-in-Progress (WIP) saturating engineering pods  │
│ - Flow Distribution: Feature vs. Defect vs. Technical Debt vs. Risk    │
└───────────────────────────────────▲────────────────────────────────────┘
│ (Underpinned by)
┌───────────────────────────────────┴────────────────────────────────────┐
│ TIER 1: SYSTEM STABILITY & PIPELINE SPEED (DORA Metrics)               │
│ - Deployment Frequency (DF): Production releases per week/month        │
│ - Lead Time for Changes (MLT): Commit-to-production pipeline duration   │
│ - Change Failure Rate (CFR): % of releases causing production defects  │
│ - Mean Time to Recovery (MTTR): Time required to restore failed service│
└────────────────────────────────────────────────────────────────────────┘
---
Tier 1: Engineering Stability and Pipeline Speed (DORA Metrics)
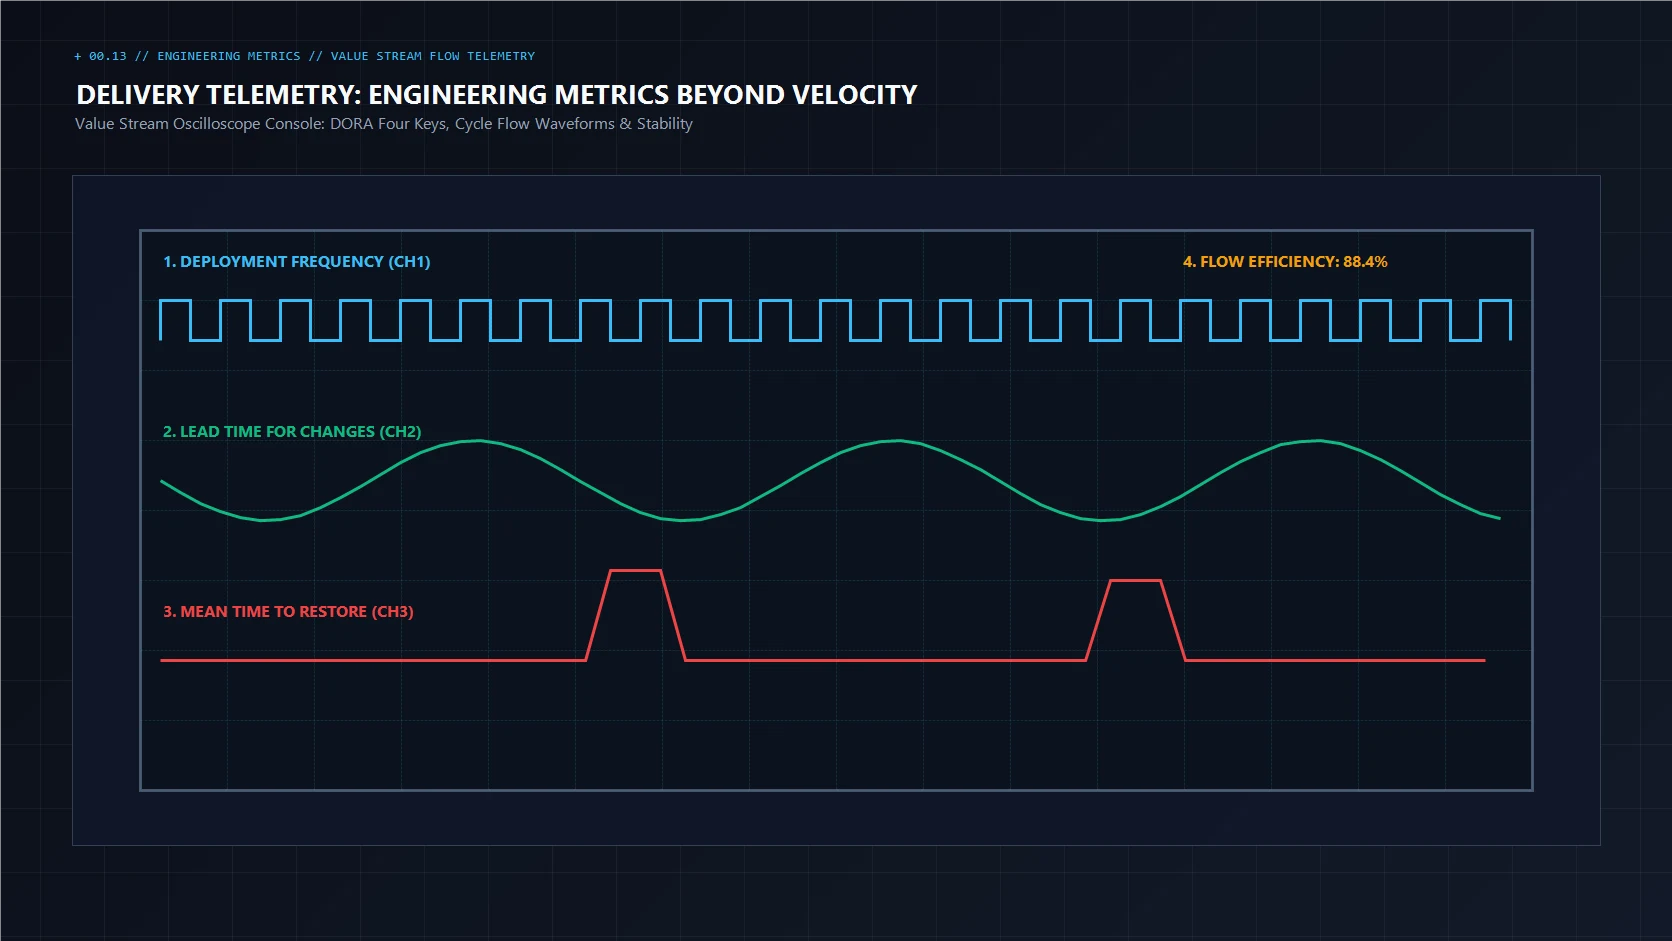
Underpinning the entire telemetry stack are the four foundational DORA metrics, captured automatically from Git repositories and CI/CD pipelines (GitHub Actions, GitLab, ArgoCD):
| Metric | High-Performing Benchmark | What It Reveals to Leadership |
|---|---|---|
| Deployment Frequency (DF) | Multiple deploys per day to production | Agility and modularity; small, low-risk releases rather than massive, fragile quarterly cutovers. |
| Lead Time for Changes (MLT) | Less than 24 hours from commit to production | Efficiency of automated testing, container builds, and security scans; zero manual handoff friction. |
| Change Failure Rate (CFR) | Less than 5% of production deployments | Quality and rigor of pre-deployment automated test coverage and synthetic staging environments. |
| Failed Deployment Recovery (MTTR) | Less than 1 hour to remediate or roll back | Sophistication of automated rollback pipelines, canary releases, and runtime observability. |
Strategic Insight for Executives: If an engineering organization has an elite Deployment Frequency and Lead Time, it possesses the technical capability to respond immediately to market threats or regulatory changes. If Lead Time exceeds 30 days, any new strategic initiative launched by the board will take months before the first line of code touches a customer.
---
Tier 2: Value Stream Flow Telemetry (The Flow Framework)
While DORA measures pipeline mechanics, the Flow Framework measures how business value moves through the entire delivery system from initial concept to customer delivery:
1. Flow Time
Measures the total elapsed calendar time from the moment a business feature request is accepted into the active backlog to the moment it is live in production. This metric exposes hidden wait states, bureaucratic approval delays, and cross-team dependency stalls.
2. Flow Efficiency
The ratio of active working time (when an engineer is actively designing, coding, or testing) divided by total Flow Time. In most traditional enterprises, Flow Efficiency is low, frequently falling between 5% and 15%. That means 85% to 95% of the time required to deliver a feature is spent waiting: waiting for architecture approvals, waiting for test environments, waiting for cross-vendor APIs, or waiting for code reviews. Increasing Flow Efficiency from 10% to 30% triples delivery speed without hiring a single additional engineer.
3. Flow Load (WIP Saturation)
Tracks the total number of active, uncompleted items currently in flight across the engineering organization. When Flow Load exceeds team cognitive capacity, context switching skyrockets, error rates spike, and overall delivery throughput collapses. Capping Flow Load through strict Work-in-Progress (WIP) limits is the single fastest way to restore delivery velocity.
4. Flow Distribution: The 4 Work Profiles
Every engineering team spends its capacity on four fundamental types of work:
- Features: New business capabilities driving revenue or customer experience.
- Defects: Remediation of bugs and software quality regressions.
- Technical Debt: Architectural refactoring, dependency upgrades, and codebase modernization.
- Risk / Security: Compliance patches, security vulnerability mitigations, and regulatory controls.
THE FLOW DISTRIBUTION WARNING SIGN
┌─────────────────────────────────────────────────────────────┐
│ If an enterprise allocates 90% of capacity to Features       │
│ and 0% to Technical Debt for three consecutive quarters:    │
│                                                             │
│ 1. Codebase complexity compounds exponentially              │
│ 2. Defect volume surges from 10% to 50% of capacity         │
│ 3. Future feature velocity grinds to a total halt           │
└─────────────────────────────────────────────────────────────┘
A healthy executive governance rhythm enforces a disciplined Flow Distribution: typically 60% Features, 15% Defects, 15% Technical Debt, and 10% Risk.
---
Tier 3: Business Value Realization (Boardroom Alignment)
The apex of the telemetry architecture connects technical releases to tangible business impact:
- Feature Adoption Velocity: Tracking the percentage of target users who actively adopt a newly released software feature within 30 days of production release. If a team ships a feature on time, but user adoption is under 5%, the initiative has failed to deliver business value.
- Infrastructure Unit Cost per Transaction: Measuring the cloud compute, database, and licensing cost required to process a single business transaction (e.g., $0.004 per processed payment). This metric verifies that software modernization is improving computational efficiency rather than inflating cloud bills.
- Business Process Cycle Time Reduction: Quantifying the direct operational impact of digital automation (e.g., reducing loan application processing time from 4 days to 4 minutes).
---