

The Adoption-Capability Paradox
The fundamental failure mode of enterprise architecture is the adoption-capability gap: adopting architectural patterns designed for hyperscale technology companies without possessing the operational scaffolding, automated observability, and engineering density required to sustain them.
THE ADOPTION-CAPABILITY GAP
┌────────────────────────────────────────────────────────────────────────┐
│ ARCHITECTURAL ADOPTION LEVEL (Tooling / Distributed Complexity)        │
│ ▲                                                                      │
│ █  HIGH ADOPTION / LOW CAPABILITY:                                     │
│ █  "The Complexity Trap"                                               │
│ █  - Extreme cognitive load on squads                                  │
│ █  - Fragmented failure domains                                        │
│ █  - High architectural debt & rework                                  │
│ █                                                                      │
│ █                            BALANCED TRAJECTORY:                      │
│ █                            Sustainable Platform Engineering          │
│ █                            - Governed cognitive boundaries           │
│ █                            - Standardized golden paths               │
│ █                            - Continuous technical debt telemetry     │
│ █                                                                      │
│ █  LOW ADOPTION / LOW CAPABILITY:                                      │
│ █  Monolithic Stagnation                                               │
│ █  - Brittle releases & slow cycles                                    │
│ █  - High operational toil                                             │
│ └──────────────────────────────────────────────────────────────────────►
│ 0                        INSTITUTIONAL DELIVERY CAPABILITY MATURITY     MAX
└────────────────────────────────────────────────────────────────────────┘
When an enterprise introduces modern architectural paradigms into an organization with low delivery capability:
- Cognitive Load Saturation: Engineering squads spend disproportionate cognitive bandwidth configuring service discovery, sidecar proxies, and distributed tracing rather than shipping functional business logic.
- Distributed Monolith Antipattern: Services become decoupled in deployment but remain tightly coupled in runtime dependencies and database schemas, combining the latency and failure modes of distributed systems with the coordination rigidity of legacy monoliths.
- Operational Telemetry Voids: Distributed failures become nondeterministic. Incident triage shifts from localized code inspection to multi-team war rooms parsing asynchronous logs across disconnected observability silos.
---
EVIDENCE: Empirical Indicators of Architectural Failure
Empirical software engineering research underscores the direct link between architectural complexity, cognitive overload, and software delivery performance:
- Cognitive Load & Software Delivery Performance: In Team Topologies (Skelton & Pais), empirical delivery observations across global engineering teams demonstrated that unbounded team cognitive load directly degrades software delivery velocity, increases defect injection rates, and drives developer burnout.
- Architectural Debt & Maintenance Drag: Research published in IEEE Software indicates that unaddressed architectural technical debt accounts for between 25% and 40% of ongoing engineering maintenance expenditure in mature enterprise systems, diverting capital from value-generating feature delivery.
- DORA Benchmark Corroboration: The DevOps Research and Assessment (DORA) program consistently demonstrates that architectural modularity (specifically the ability of teams to make changes to their services without cross-team synchronization or orchestration) is a primary predictor of continuous delivery performance and organizational stability.
---
BHR CODE PERSPECTIVE • OPERATIONAL MODEL
The Enterprise Architecture Adoption-Capability Matrix
To prevent hype-driven modernization and evaluate platform investments against actual operational maturity, BHR Code structures architectural evaluation across four foundational dimensions:
THE ARCHITECTURAL EVALUATION MATRIX
├── 01. COGNITIVE RELEVANCE & FIT
│   └── Does this architectural pattern simplify or complicate the domain boundaries of the business?
├── 02. DELIVERY TEAM MATURITY
│   └── Does the maintaining organization possess production telemetry, CI/CD automation, and SRE maturity to operate this pattern?
├── 03. COMPOSABILITY & REVERSIBILITY
│   └── Can this architectural component be decoupled, replaced, or rolled back without triggering a multi-quarter re-platforming crisis?
└── 04. TOTAL COST OF ARCHITECTURAL OWNERSHIP (TCO)
└── Does the operational overhead of running this infrastructure outweigh the business velocity gained from its adoption?
1. Cognitive Relevance & Domain Boundaries
Modernization must reflect genuine domain complexity rather than arbitrary micro-segmentation. If a business domain has unified transactional integrity requirements, forcing distributed eventual consistency across three separate microservices creates unnecessary coordination overhead. Architectural decisions must map directly to business domain boundaries (Domain-Driven Design).
2. Golden Paths Over Tooling Proliferation
High-performing enterprise architecture functions do not impose rigid centralized mandates, nor do they allow unconstrained bottom-up tool proliferation. Instead, they engineer "Golden Paths" (pre-packaged, compliant, secure infrastructure-as-code templates and delivery pipelines) that make the resilient, observable architectural choice the path of least resistance for product squads.
3. Active Technical Debt Amortization
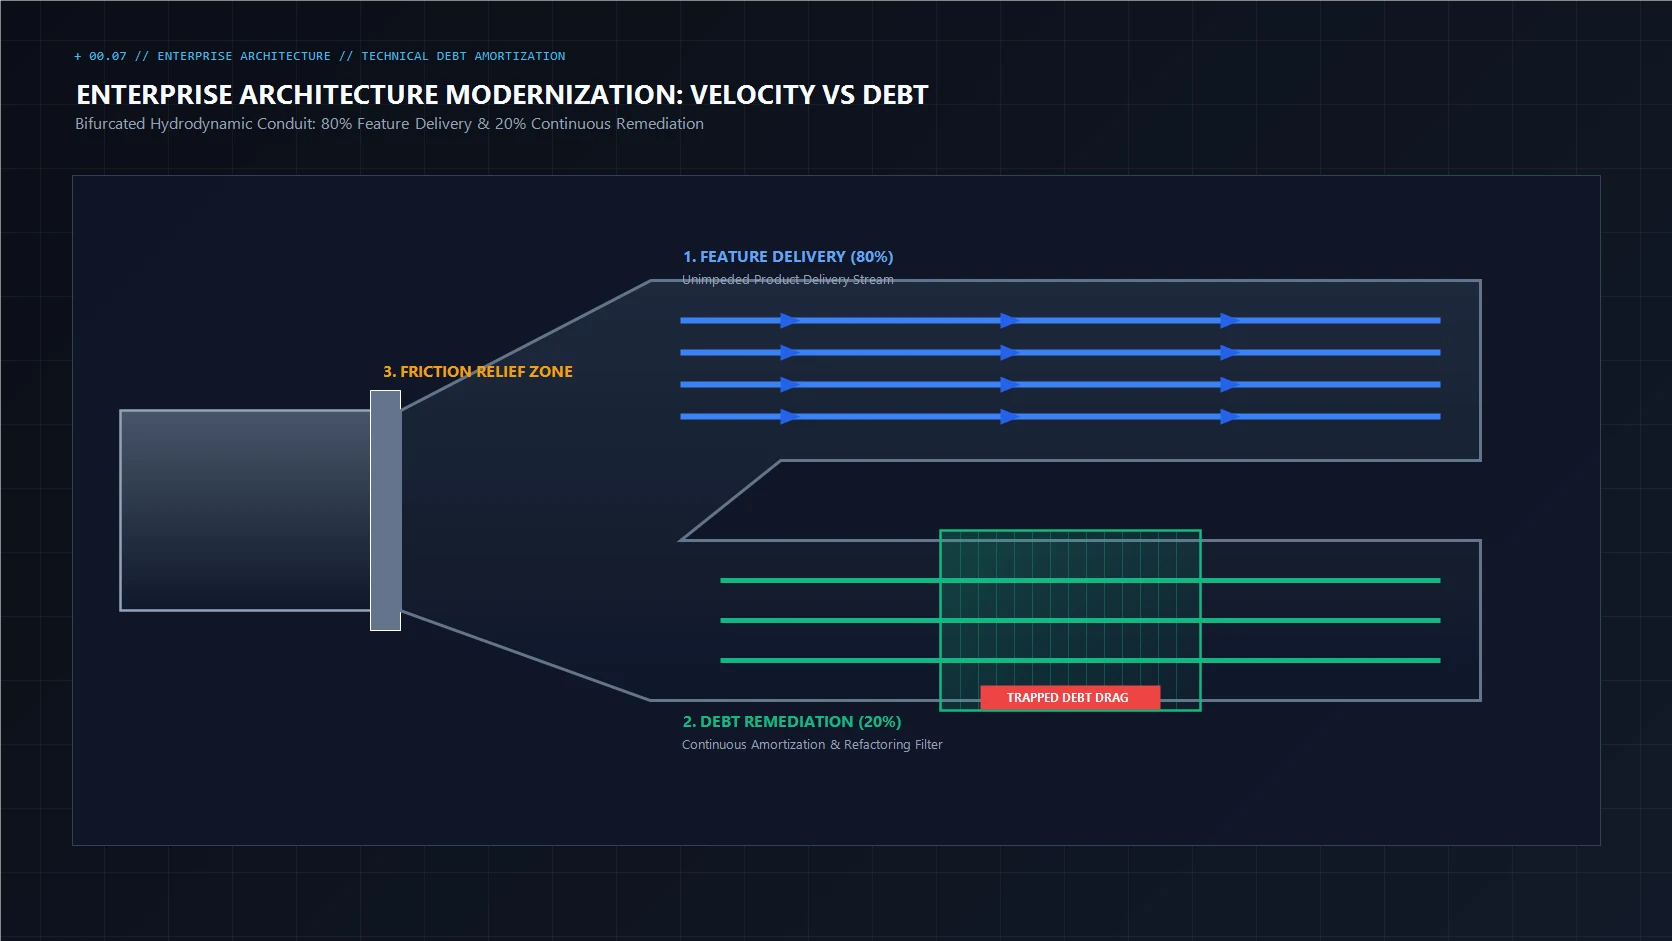
Technical debt cannot be treated as an abstract engineering grievance; it must be measured as an operational liability. Forward-looking architectural teams institute telemetry that quantifies architectural debt: tracking component depreciation cycles, interface coupling ratios, and team ticket-to-feature ratios. While empirical research demonstrates that technical debt creates severe maintenance and delivery drag, establishing an exact remediation percentage is an organizational choice. As a BHR Code governance heuristic, organizations may establish an explicit capacity allocation for technical-debt remediation, using 15% to 20% as an illustrative governance starting point calibrated to system criticality, debt burden, and delivery context, rather than an externally mandated or universally optimal benchmark.
---
STRATEGIC OUTLOOK: The Evolution of Enterprise Architecture
Over the coming 24 to 36 months, enterprise architecture will increasingly transition from static review boards and PDF diagrams toward executable architecture and automated governance.
Platform engineering teams will embed architectural guardrails directly into developer platforms through policy-as-code engines, automated dependency graphs, and drift-detection telemetry. Enterprise architectures that succeed will prioritize simplicity, cognitive containment, and operational resilience over distributed novelty.
---
Leadership Lenses: Strategic Implications
For the Chief Information Officer (CIO)
- Ensure that enterprise technology investments are evaluated against delivery team execution capability, not vendor product roadmaps.
- Enforce capital allocation policies that pair every major platform adoption with explicit enablement, training, and operational telemetry funding.
For the Chief Architect
- Discontinue static architecture review boards (ARBs) that evaluate designs solely on paper; replace them with automated conformance checks, reference architectures, and developer golden paths.
- Establish an architectural fitness ledger that tracks interface coupling, dependency health, and technical debt across all production domains.
For the Head of Engineering
- Monitor squad cognitive load closely. If squads are spending excessive capacity managing infrastructural infrastructure rather than product features, intervene to standardize the platform layer.
- Champion continuous architectural amortization within sprint cycles to avoid accumulating unmanageable legacy debt.
---