

The Flaw of Transactional Workforce Metrics
Transactional metrics create organizational distortions when used as proxies for technology capability:
INPUT METRICS VS. CAPABILITY OUTCOMES
┌────────────────────────────────────────────────────────────────────────┐
│ TRANSACTIONAL RECRUITMENT METRICS (Inputs)                             │
│ Time-to-Fill | Cost-per-Hire | Headcount Volume | Billing Utilization  │
│ - Measures administrative throughput, not technical competence         │
│ - Incentivizes lowering hiring standards to close requisitions quickly │
│ - Blind to team cohesion, domain depth, and execution friction         │
├────────────────────────────────────────────────────────────────────────┤
│ ENTERPRISE CAPABILITY SCORECARD (Outcomes & Telemetry)                 │
│ Operational Readiness | Delivery Velocity | Release Stability | SLAs   │
│ - Measures actual system throughput and architectural durability       │
│ - Quantifies squad maturity, cognitive stability, and rework drag      │
│ - Aligns technology investments directly with business outcomes        │
└────────────────────────────────────────────────────────────────────────┘
The primary limitations of managing technology organizations through headcount alone include:
- The Utilization Trap: High billable utilization does not equal productive delivery. Squads can be 100% utilized fixing recurring bugs, managing manual releases, and navigating architectural debt without shipping a single high-value business feature.
- The "Warm Body" Fallacy: Adding headcount to a lagging software project frequently slows it down further (Brooks’ Law) due to exponential increases in communication and coordination friction.
- Absence of Quality Signals: Input-based tracking fails to detect quality degradation until software reaches production, where incident triage costs an order of magnitude more than preventative testing.
---
EVIDENCE: Research on Engineering Productivity and Operational Measurement
Empirical software engineering and organizational governance research emphasizes the necessity of multi-dimensional measurement systems:
- DevOps Research and Assessment (DORA) Longitudinal Data: The DORA research program has rigorously demonstrated that high-performing technology delivery organizations do not sacrifice stability for speed; instead, they excel simultaneously across deployment frequency, lead time for changes, change failure rate, and time to restore service.
- The SPACE Framework for Developer Productivity: Research published in ACM Queue by Forsgren, Storey, et al. established that developer and team productivity cannot be captured by a single metric (such as lines of code or ticket counts). Sustainable measurement requires capturing five interrelated dimensions: Satisfaction, Performance, Activity, Communication and Collaboration, and Efficiency and Flow.
- Kaplan & Norton Balanced Scorecard Principles: Foundational management science establishes that balanced performance measurement must encompass operational process efficiency, institutional learning and growth, customer outcomes, and financial stewardship to prevent localized sub-optimization.
---
BHR CODE PERSPECTIVE • OPERATIONAL MODEL
The Enterprise Capability Scorecard Architecture
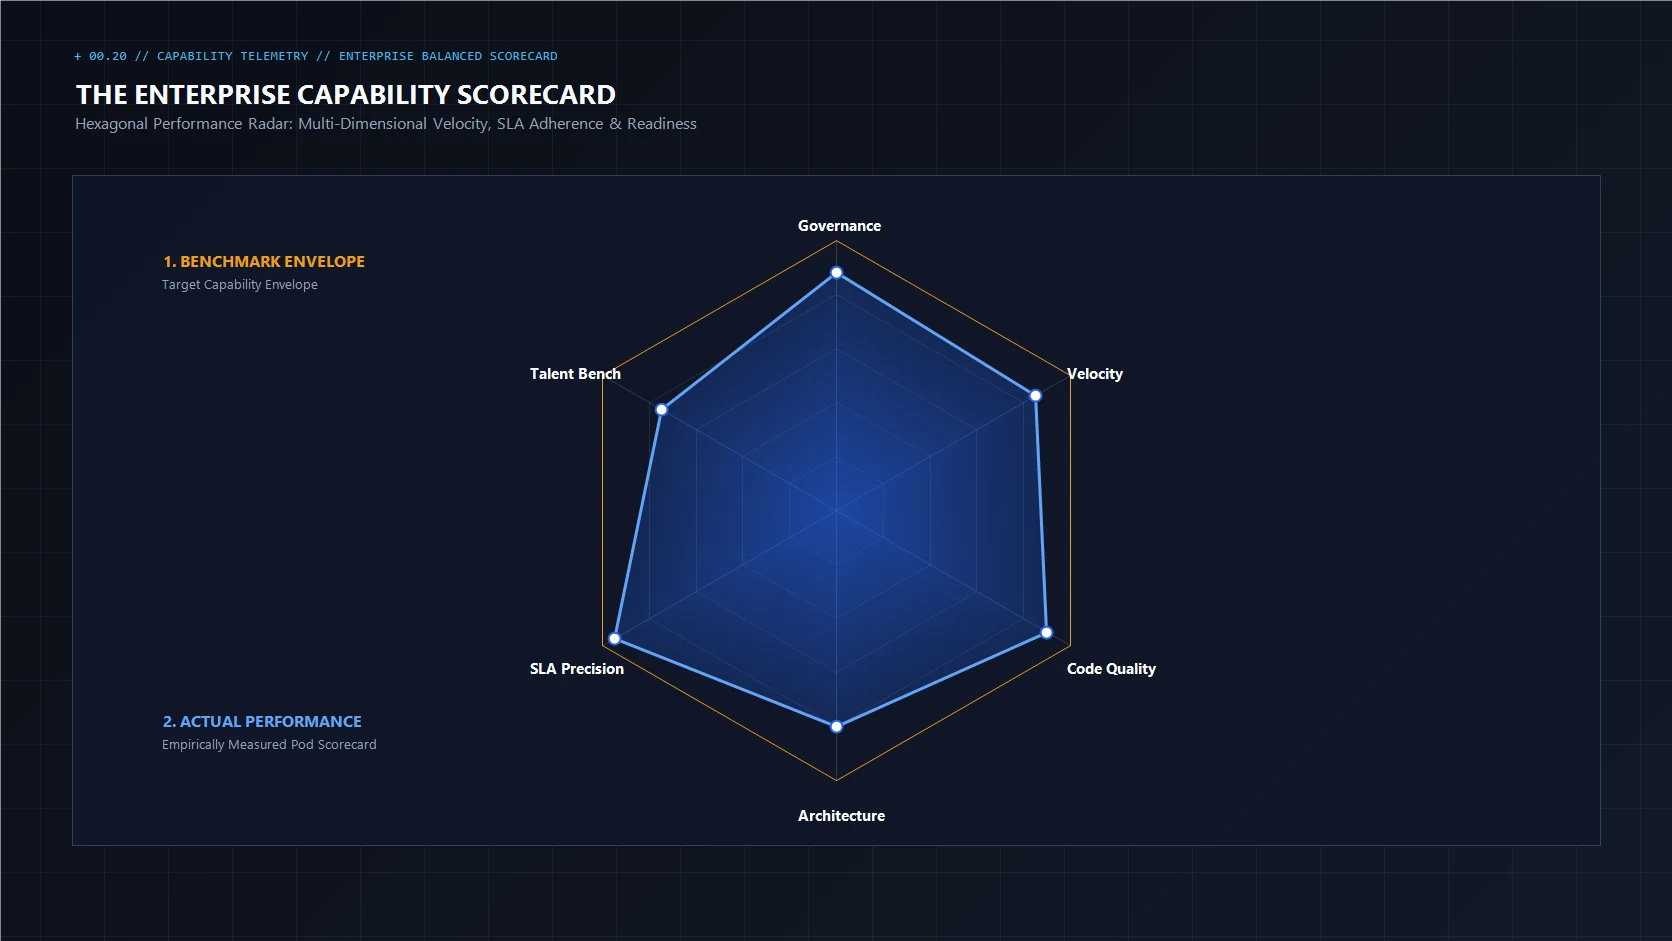
To provide an integrated, tamper-evident view of organizational delivery health, BHR Code structures the Enterprise Capability Scorecard across four balanced operational pillars:
THE FOUR PILLARS OF THE CAPABILITY SCORECARD
├── 01. OPERATIONAL READINESS & SQUAD MATURITY
│   └── Team stability, onboarding velocity, domain continuity, and critical-role redundancy.
├── 02. DELIVERY VELOCITY & FLOW EFFICIENCY
│   └── Cycle time, deployment frequency, lead time for changes, and work-in-progress (WIP) flow.
├── 03. ENGINEERING QUALITY & RELEASE STABILITY
│   └── Change failure rates, automated test coverage, rework ratios, and mean time to recovery (MTTR).
└── 04. SLA & BUSINESS OUTCOME ATTAINMENT
└── Contractual uptime, milestone delivery adherence, user adoption depth, and stakeholder CSAT.
Pillar 01: Operational Readiness & Squad Maturity
This pillar measures the structural foundation of the delivery organization:
- Squad Stability Index: The percentage of squad members retained over a rolling 6-to-12-month horizon. Chronic churn resets team domain memory and degrades velocity.
- Time-to-First-Commit (Onboarding Velocity): The business days required for a newly onboarded engineer or pod to deploy a verified code change into a pre-production or production pipeline.
- Bus Factor & Domain Continuity: Identifying single points of failure where critical system knowledge resides exclusively with an individual contributor.
Pillar 02: Delivery Velocity & Flow Efficiency
This pillar tracks how efficiently requirements translate into deployed production software:
- Lead Time for Changes: The time elapsed from code commit to successful deployment in production.
- Flow Efficiency: The ratio of active development time versus passive waiting time (waiting for code reviews, environment provisioning, or manual approvals).
- Deployment Frequency: How often the team deploys code to production environments, serving as a primary indicator of automated pipeline maturity.
Pillar 03: Engineering Quality & Release Stability
This pillar monitors the operational durability of delivered software:
- Change Failure Rate (CFR): The percentage of production deployments that require immediate remediation, emergency hotfixes, or rollback.
- Defect Escape Ratio: The proportion of defects discovered by end-users in production versus those caught internally by automated pipelines and pre-release testing.
- Rework Ratio: The proportion of engineering capacity consumed by fixing newly written code rather than building new capability.
Pillar 04: SLA & Business Outcome Attainment
This pillar connects engineering output directly to enterprise commitments:
- Milestone Delivery Adherence: The predictability with which committed roadmap capabilities are delivered within agreed schedule and scope buffers.
- Service Level Agreement (SLA) Compliance: Uptime, API latency thresholds, and incident resolution compliance against formal operational agreements.
- Business Capability Telemetry: Real-world adoption metrics verifying that delivered software is actively utilized by target business stakeholders.
---
STRATEGIC OUTLOOK: Automated Scorecards and Delivery Telemetry
Over the next 24 to 36 months, enterprise capability measurement will transition from manual monthly surveys and static presentation decks into automated, real-time delivery telemetry.
Modern engineering control planes will ingest data directly from source code repositories, CI/CD orchestration engines, issue tracking systems, and production observability platforms. By applying automated trend analysis across these streams, executive scorecards will dynamically surface early-warning indicators of team distress, architectural debt, or operational burnout weeks before project delivery dates are compromised.
---
Leadership Lenses: Practical Implementation
For the Chief Operating Officer (COO)
- Replace static monthly status reports with a live capability scorecard dashboard integrated into executive operational reviews.
- Use squad maturity and flow efficiency metrics to identify organizational bottlenecks (e.g., procurement delays, security review queues) that impede delivery.
For the Chief Human Resources Officer (CHRO)
- Partner with delivery leaders to correlate talent retention and training investments directly with engineering stability and team maturity scores.
- Re-orient talent acquisition performance appraisals around onboarding velocity and squad longevity rather than purely time-to-fill.
For the Chief Financial Officer (CFO)
- Evaluate technology vendor contracts and internal IT budgets against demonstrable capability scorecard outcomes rather than logged hours or seat counts.
- Leverage quality stability metrics to quantify the financial drag of ongoing rework and technical debt.
---